Seasonal characteristics of outdoor thermal comfort and residential electricity consumption: A Snapshot in Bangkok Metropolitan Area
Nguyen, C. T.+, Nguyen H., Sakti, A. D., 2024. Seasonal Characteristics of Outdoor Thermal Comfort and Residential Electricity Consumption: A Snapshot in Bangkok Metropolitan Area. Remote Sensing Applications: Society and Environment. 33, 101106. 10.1016/j.rsase.2023.101106
Outdoor thermal comfort negatively influences urban residents’ health and increases residential electricity consumption (REC) for cooling demand. This study adopted the remote sensing-based modified temperature-humidity index (MTHI) to monitor and assess seasonal and spatial characteristics of urban thermal comfort and its association with REC. Thermal comfort and REC have a strong correlation (p < 0.05) and the same seasonal patterns as regional climate patterns. Thermal comfort is mainly controlled by land use, land cover (LULC), and physical characteristics of the built environments. Among the physical features, the building height is the most prominent element stimulating thermal discomfort as it regulates other elements linking to urban microclimates, such as sky view factor and ventilation. The thermal comfort in a particular region will be remarkably improved when urban density and building height remain under 65.43% and 17.88 meters, respectively. A green space proportion above 18.9% is also a reference value to optimize thermal comfort in built environments. The most vulnerable regions because of thermal discomfort in the Bangkok Metropolitan Area (BMA) account for 21.4% of the dense urban centers, with a building density of 72.5% and a population density of 17,173 persons/km2. The research findings enrich the current knowledge of thermal comfort characteristics and REC, which are significantly helpful for regional planning to mitigate thermal discomfort in this megacity.
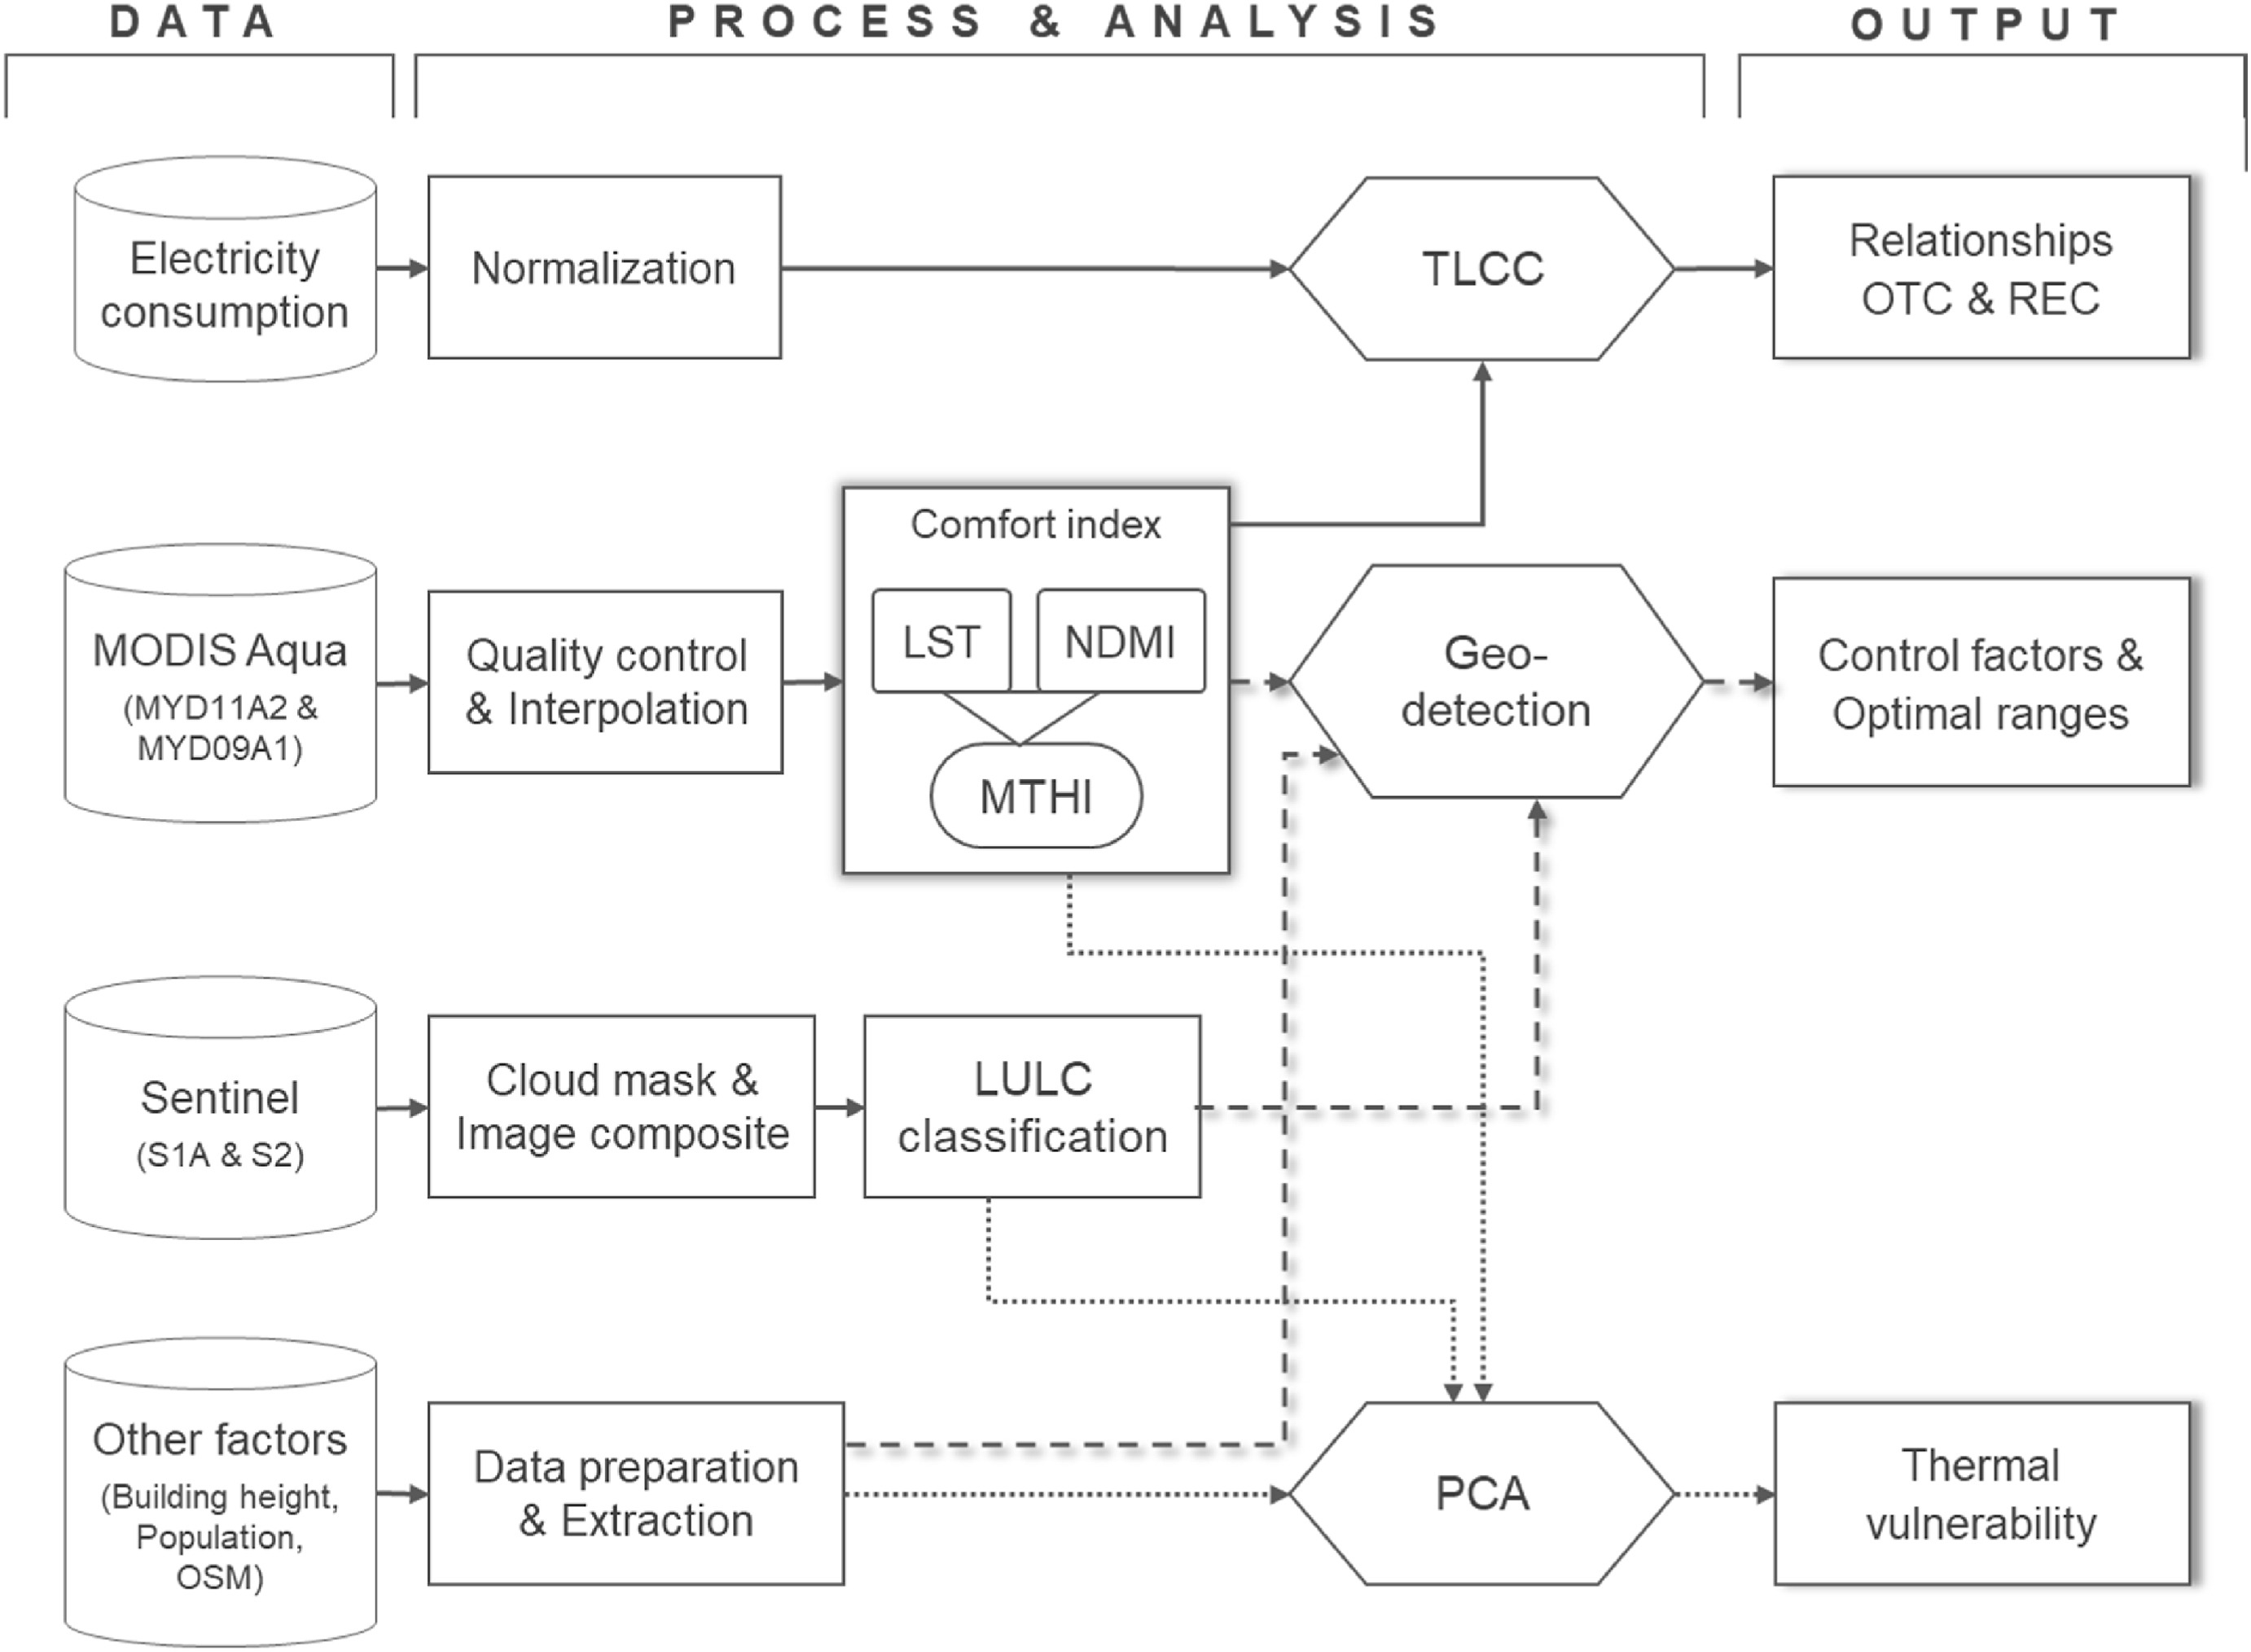
Methodological framework illustrates data sources, principal analyses, and outputs of this research
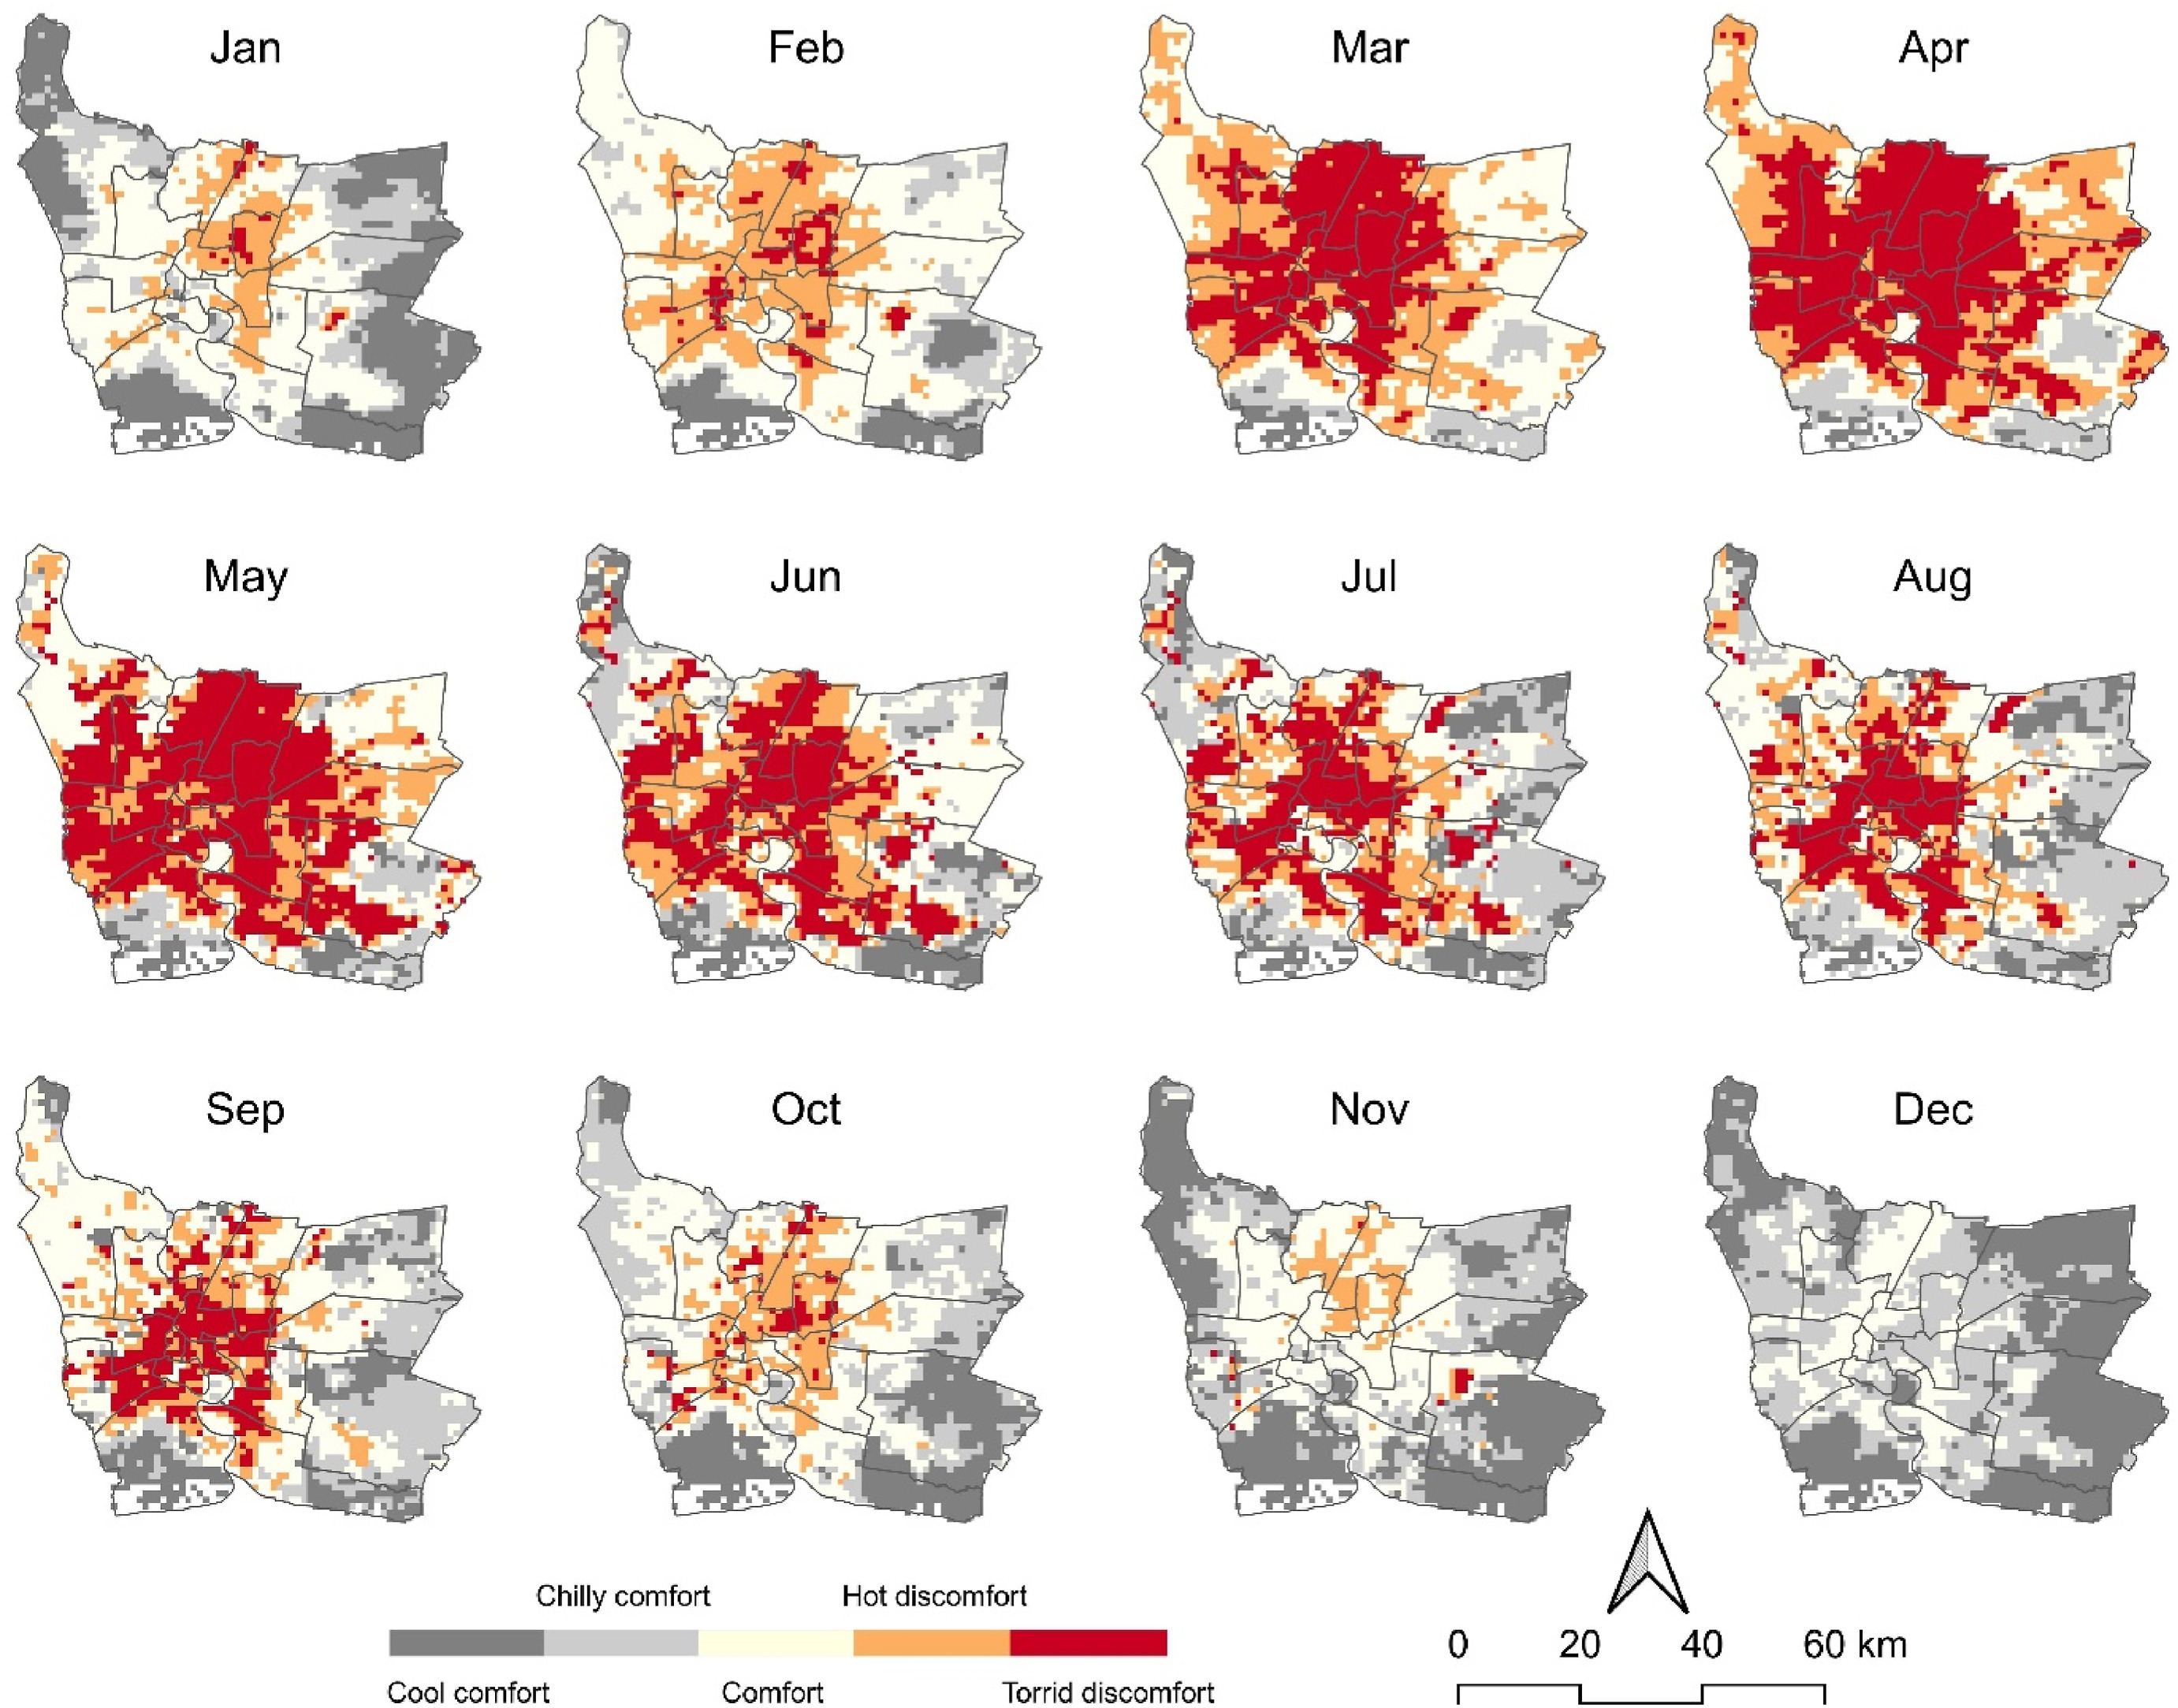
Daytime thermal comfort categories were classified based on MTHI over months in 2017
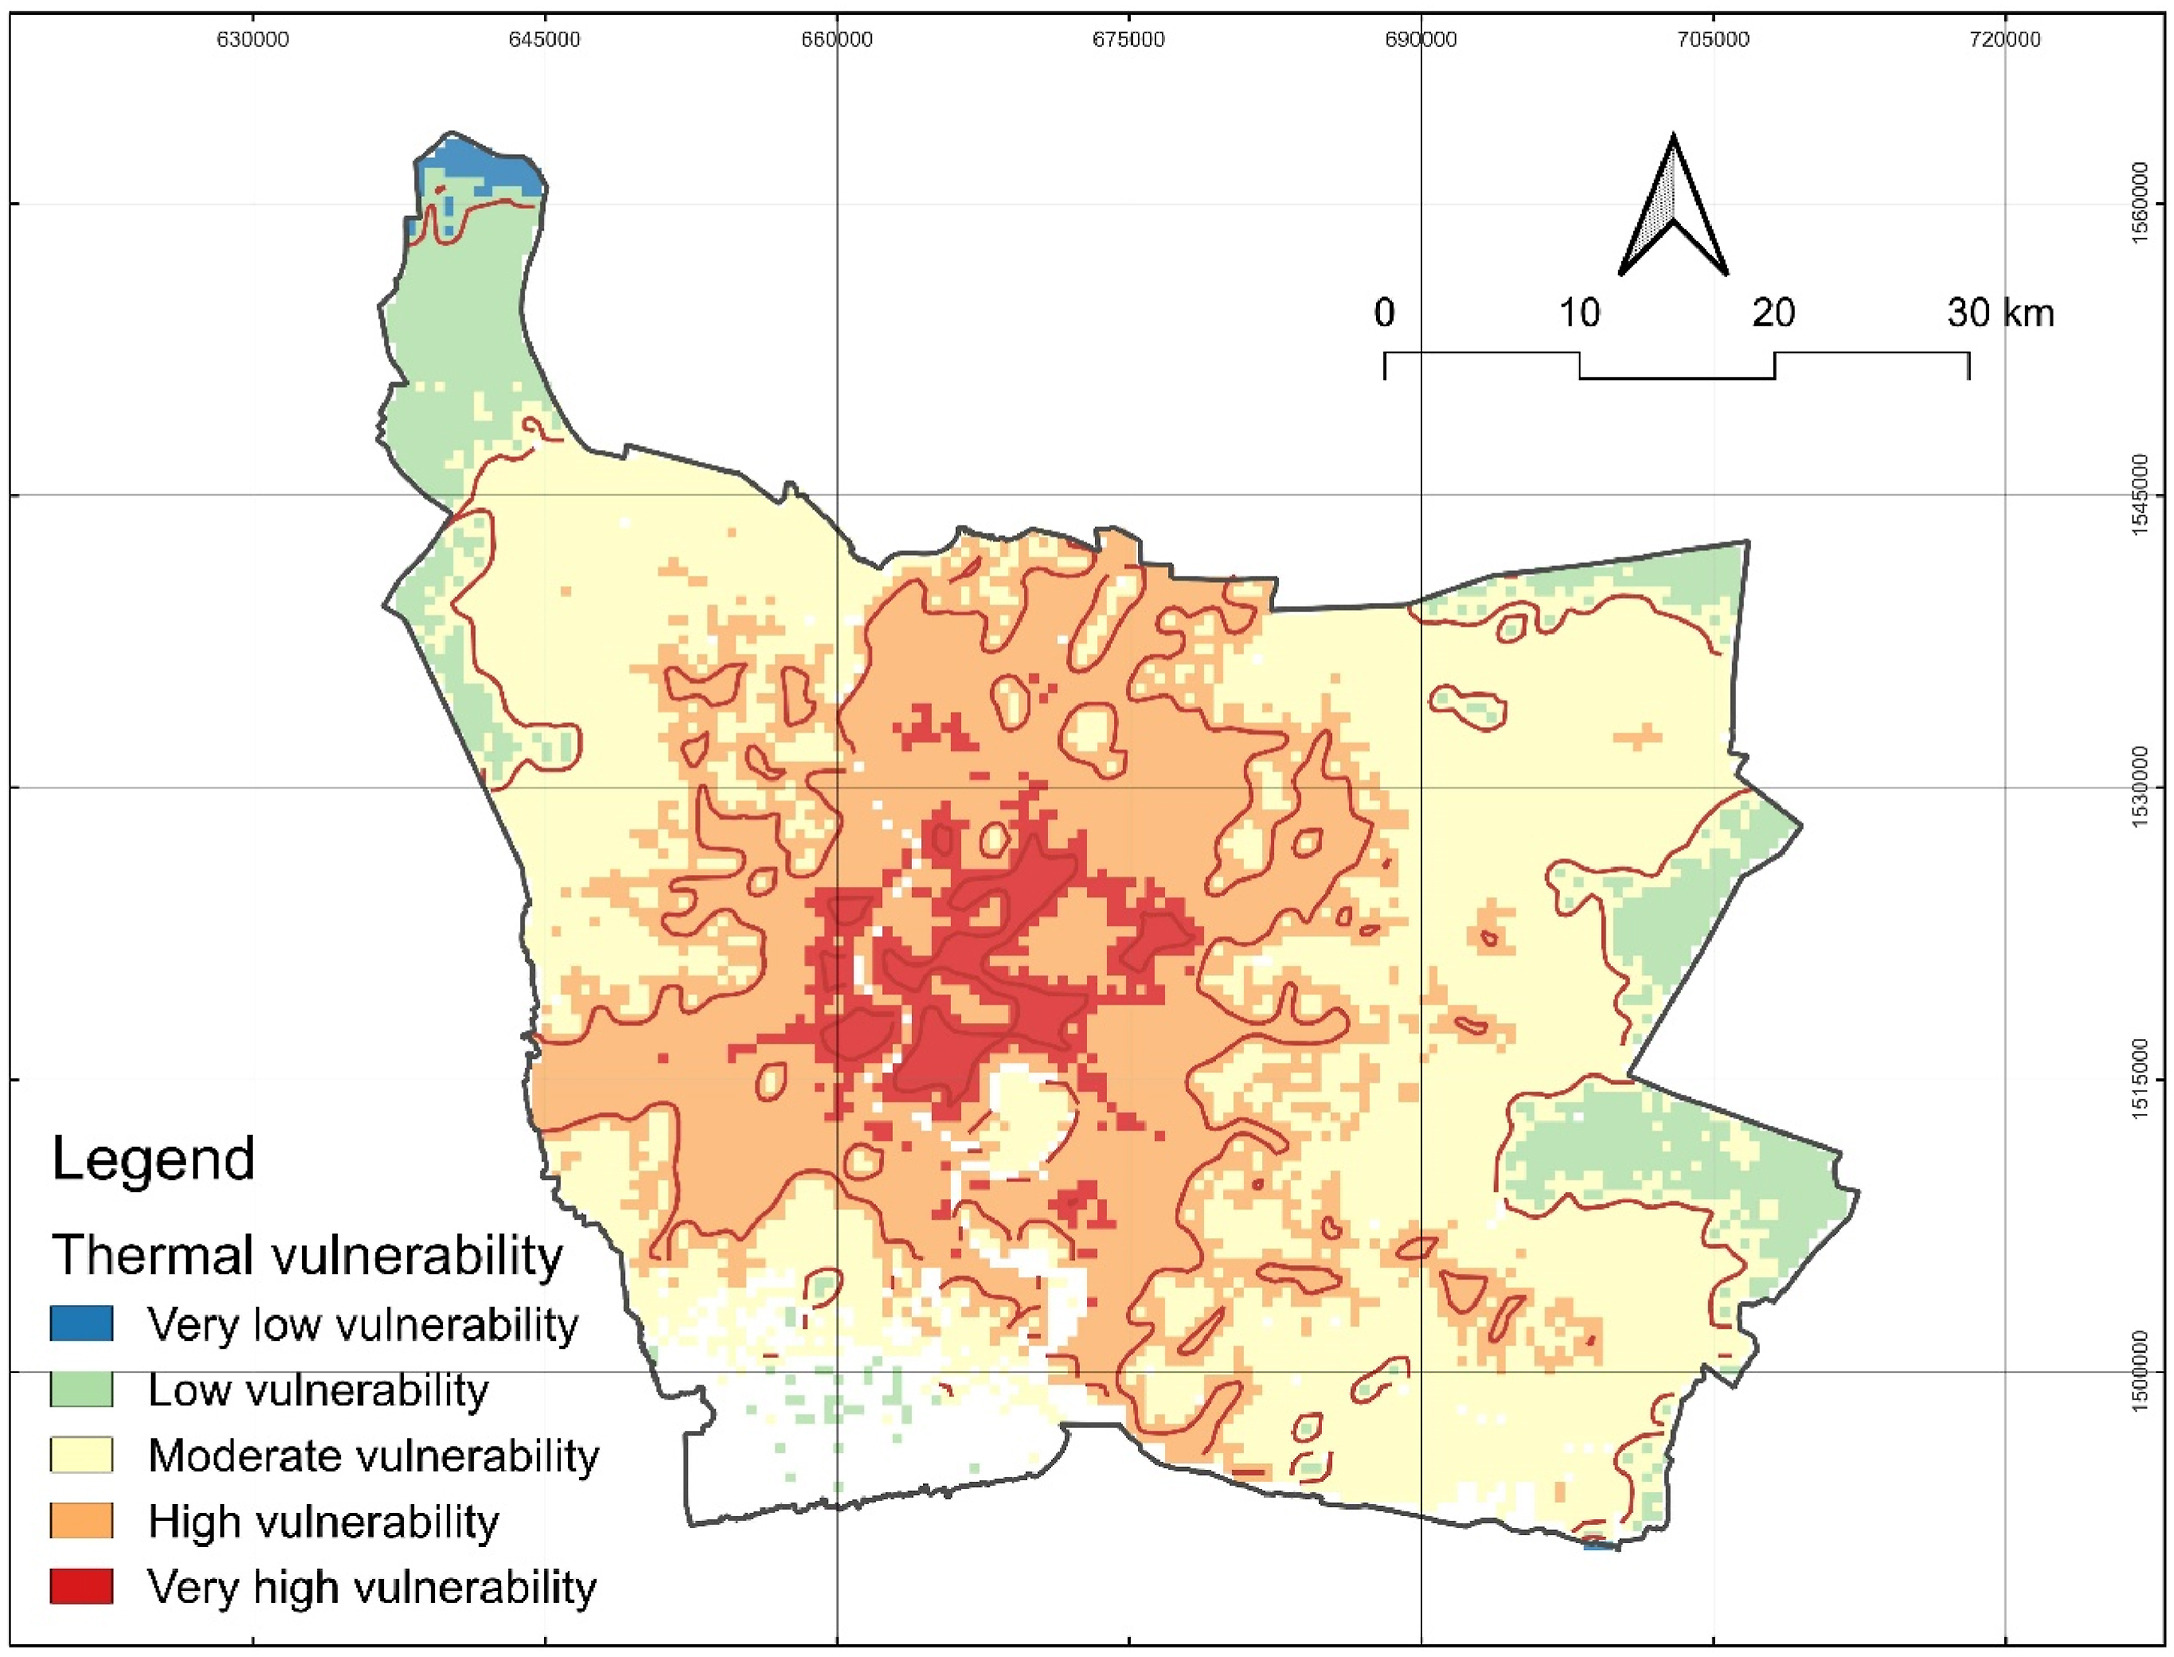
Thermal vulnerability map over the BMA from synthesized data. Contour lines zoning the core regions for each thermal vulnerability class
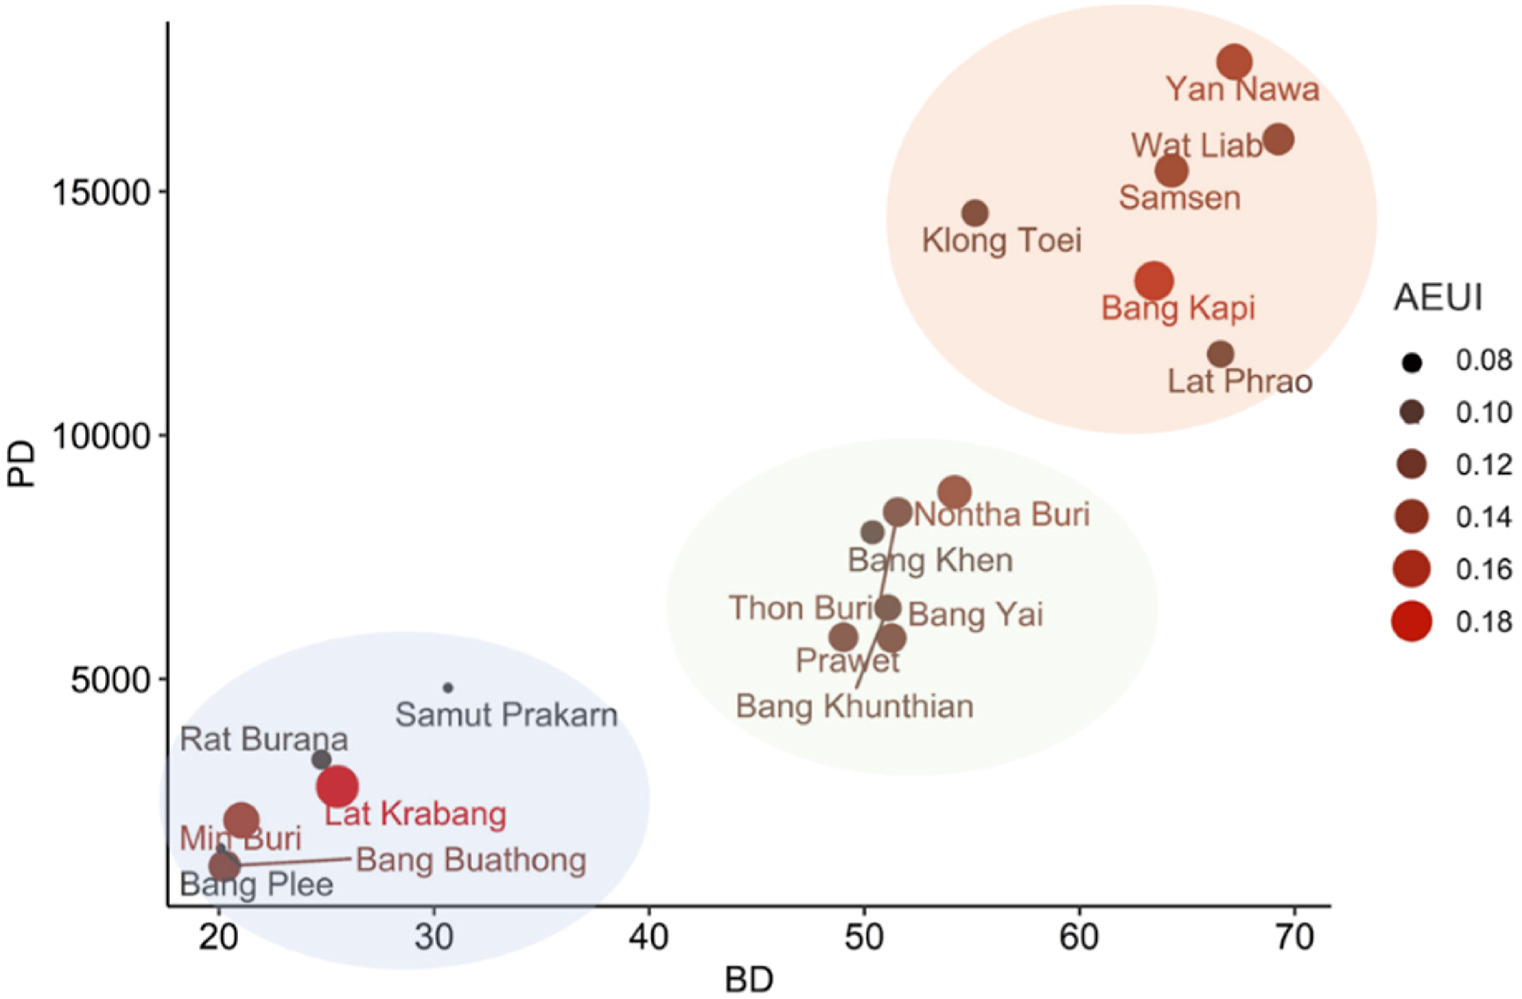
Relationships between PD, BD, and Adjusted Electricity Use Index (AEUI). Dot size is proportional to the magnitude of AEUI (Unit: kWh/m3/month). Three groups from the bottom-left correspond to a gradual increase in PD and BD. The lower the AEUI value, the higher the electricity efficiency